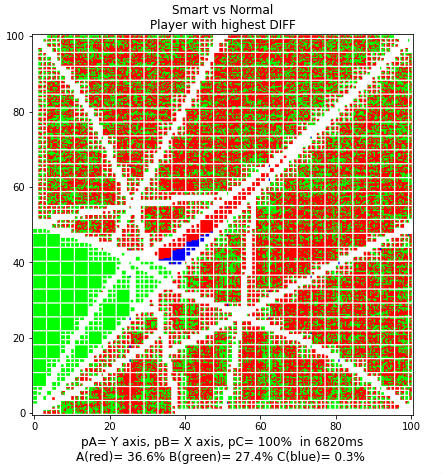
About a year ago I decided to estimate usability of Jupyter notebook documents with Python code. Since both Python and Jupyter were new to me at that time, I selected real world problem to solve using them, specifically to solve “Truel” problem :
Several people are doing duel. Given their probabilities to hit, what are probability of each of them to win and who should they choose as optimal initial target ?
Resulting solution, as static HTML page showing results of Truel analysis using python functions, can be seen at link below :
 Truel solver as Python based Jupyter notebook
Of course, main point in using Jupyter was to have interactive document. That document ( including both python source and Truel problem analysis) is available at GitHub repository , and also in ZIP form at this site. ( zip also contains already precalculated cache file, to save some 45 min of initial calculation time ). Document is best used with JupyterLab
While above link demonstrate how that solution was used to analyse Truel cases, point of this blog is to give my summary on usability of Python and Jupyter notebooks – which was initial reason why I decided to solve “Truel” problem .
Shortest possible summary would be:
Jupyter/Python/numba combination was excellent match for this problem
Especially suitable was Jupyter document, because it allows interactivity and easy analysis of different cases, while still resulting in visually good looking document. Great thing about Jupyter notebook is that it does not recalculate entire document when one cell is calculated – it remembers already calculated variables or compiled parts. This is in contrast to running same code in Visual Studio – where each small change required execution of entire Python code.
Python itself was not so excellent match out of the box for this problem, because problem is very computationally intensive – especially for 2D analysis where python functions need to solve millions of times for 1000×1000 images. And Python, by default, was much slower than solutions in C# for example. In situation where interactivity is important, it was not acceptable to wait 10+min for every analysis image. But, apart from speed, Python was good match due to simplicity of coding and especially due to great modules like numpy ( for array/matrix operations) and matplotlib ( for 2D visualization )
Python performance issues gave me reason to explore numba – which is Python module that allows ‘just in time’ compilation of python code. Eventually that proved right combination – numba accelerated python functions were fast enough to produce 2D solutions in seconds on average, which was acceptable from interactivity point of view.
Problems and shortcomings of Jupyter/Python/numba ( and workarounds )
While eventually this proved to be good match, each of those technologies had some problems or limitations – some of them were overcome in this solution, while some remain:
- python is slow – standard python is slow when millions of complex calculations are needed. But this can be overcome by using numba
- numba often requires rewriting python code – mostly due to type ambiguities, but also some python features are not supported in numba. This can not be exactly overcome, but is easy to comply when writing numba code from start. Modifying old python code to numba is also not hard usualy – but can be tricky in some cases.
- Jupyter notebook does not have debug option – some bugs are hard to detect without that. This can be be overcome by running same code in Visual Studio , and debugging there. Not ideal option, since it may require slight code rearrangement – and also does not support numba debugging ( solvable by temporary marking functions as non-numba, since numba code is also valid python code ).
- Jupyter nootebook often requires ‘run all cells’ – and that can result in 30min computation for entire Truel document, which have many complex 2D comparisons ( most needing just few seconds, but some need few minutes each ) . I solved this problem by introducing cache for large results ( eg 2D analysis data ), and running code again without forcing recalculation will simply retrieve last result from cache – resulting in 30x faster ‘run all cells’ ( with majority of remaining time spent to recompile all numba functions )
Conclusion:
Jupyter notebook document, based on Python with numba accelerated functions and matplotlib enabled visualizations , was great match for this problem – and likely to be good match for any similar problem that requires interactivity and visualization.
